Old picture postcards can remind us post-war kids of golden days and acres of pure sand at the seaside. Sadly, some favourite Gower beaches of old have become unpleasantly stony, locally with exposed patches of ancient peat and clay. These include Port-Eynon and Horton, which is a single beach, Oxwich, Langland and Limeslade. In these cases, although storms and fair-weather waves seasonally sweep and return the sand, sometimes shifting it from one end of the beach to the other, as between Horton and Port-Eynon, there has been a long-term net loss (e.g., Fig. 1).
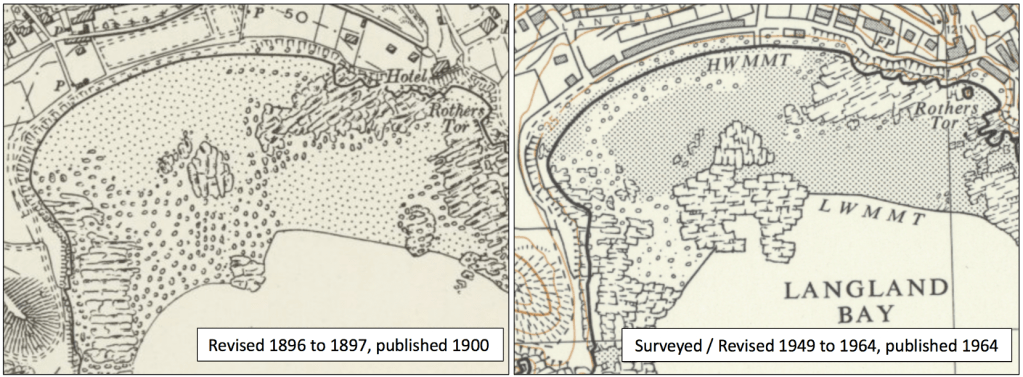
Figure 1. Successive Ordnance Survey 1:10,560 maps of Langland Bay (SS606 873) showing significant beach sand loss over some sixty-plus years. The later map (right) shows the Low Water Mark of Mean Tides (LWMMT) closer to shore than previously (it was ‘Ordinary’ Tides on the older map: LWMOT), while rock in the middle of the bay is more extensive, both showing that the top surface of the sand is lower than it was. Similarly, the stony foreshore is more extensive near the high-water mark in the later edition.
Offshore from Port-Eynon Point and continuous westwards far out beyond Worms Head is the infamous Helwick sand bank. It is 13.5 km long, up to 2.7 km wide and up to 40 m tall (Schmitt et al. 2007). Although it does not emerge, it is within a few metres of the sea surface on low tides and has caused havoc over past centuries for coastal seafarers and local fishermen alike, because huge waves can form and break over it. A lightship station was established there in 1846 and from 1971 until 1977 Lightship 91 Helwick was anchored off the bank to warn mariners. This vessel is now a familiar and treasured possession of Swansea’s maritime museum. Although long known, the true hydrodynamic beauty of the Helwick sand bank has only recently been revealed, by detailed seabed mapping, with its active ‘life’ as an ever-changing wave- and tidal-current-shaped mass only now appreciated (Fig. 2).
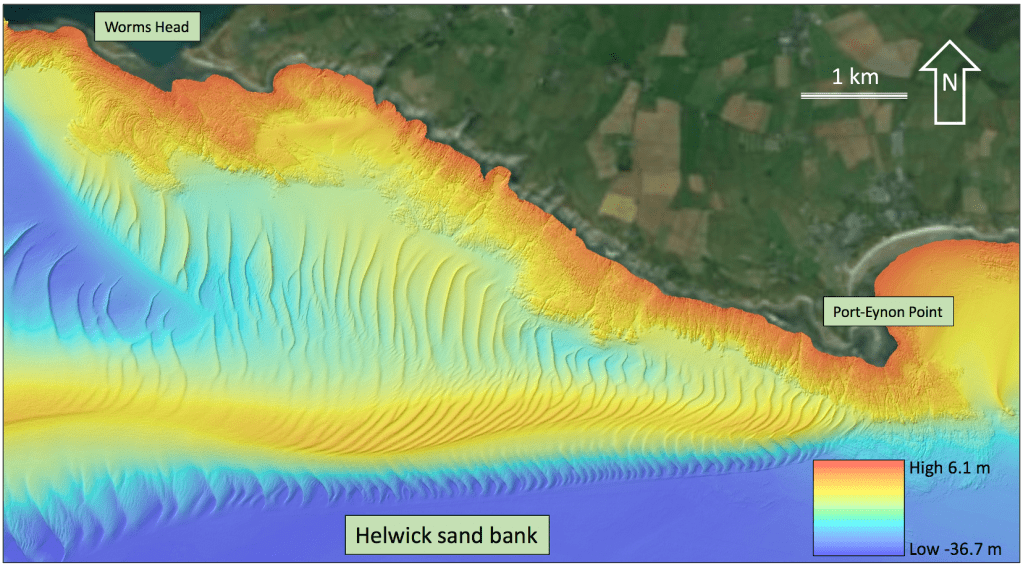
Figure 2. Inner reach of the Helwick banner sand bank, showing the beautiful physical patterns of the main bank and surface sand waves that continuously respond to tides and waves. It is, perhaps, reminiscent of a monstrous centipede. Obviously, the colours and shading are to reveal depths and slopes, but the details of the forms and their spacings hold wide-ranging information on current interactions with Port-Eynon Point and on the associated seabed sand movements. Depths are relative to the level of the lowest astronomical tide: LAT. (Base image multibeam bathymetry, at 2 m x 2 m resolution, from The Admiralty Marine Data Portal, kindly processed and provided to the author by Gareth Carter, British Geological Survey). The sand-waves on either side of the bank reflect clockwise sand movement, eastwards along the north on the incoming tide and out westwards along the south during the ebb (Schmitt et al. 2007; Schmitt and Mitchell 2014). The sand-waves between the coast and the bank move eastwards at between 20 m and 200 m per year (HR Wallingford 2016).
Cutting to the chase concerning this beautiful sand monster, dredging from its western end to extract mainly building sand, since the 1950s, has led some to believe that dredging is the cause of the long-term sand loss from some Gower beaches. In the year 2000 an application for further dredging of 300,000 tons per year for 15 years was submitted and led to a public inquiry in 2006, with Welsh Government input. The inquiry found in favour of removal of 150,000 tons per year for 7 years, subject to stringent monitoring. The ‘precautionary principle’ – don’t do it unless you know what you’re doing – was advocated, recognising a huge gulf in terms of any plausible physical explanation for a link between the dredging and beach-sand loss. Nevertheless, it was true that there were no data either way and the somewhat heated exchanges happily served to fuel the necessary investigations.
Helwick is known as a ‘banner’ sand bank because it appears tied to a headland, here Port-Eynon Point (Fig. 2). It gains its form and activity primarily from the extreme tidal regime of the Bristol Channel. Another local example is the Nash sand bank, ‘tied’ to Nash Point, the protruding belly button of South Glamorgan. The dynamics of such banks are complex, but they relate to interactions of the headland with flood and ebb reversals of the strong tidal currents (Lewis et al. 2015).
Helwick bank is generally up to 20-25 m tall, locally 40 m, and sand waves register strong eastward currents on the north side during incoming tides and westward currents on the south side during ebb tides. Although it can look steep in enhanced sea-bed images (Fig. 2), its slopes are gentle, 0.6o on the north flank and 3.5o on the south flank (Schmitt et al. 2007). Its surface sands are continuously reworked and in the medium term of several years its overall form and volume change according to the so-called ‘wave climate’, which is the timing, frequency, duration and energy of storm events each year.
During 6 years of monitoring of the sand content of the Port-Eynon and Horton (single) beach there proved to be no causative link between dredging from Helwick and beach erosion (Phillips 2008). Further, a study through 1991-2002 (Lewis et al. 2015) found that the volume of the Helwick bank decreased over an 8-year period at a rate x6 greater than the sand taken by dredging in that interval.
Helwick bank evidently alternately gains and loses mass via seabed migrating sand waves and there is no seabed connectivity for sand removed by dredging to link to any beach-sand volume (Fig. 3).

Figure 3. Coastal bathymetry off south Gower, from Worms Head, top left, to Mumbles Head, bottom right. Depths are relative to the level of the lowest astronomical tide: LAT. (Base image multibeam bathymetry, at 2 m x 2 m resolution, from The Admiralty Marine Data Portal, kindly processed and provided to the author by Gareth Carter, British Geological Survey). Dashed lines delimit seafloor exposures of rocks (folded Carboniferous strata) that elsewhere are covered by sand. Such rock exposures south of Port-Eynon extend down to 35 m below sea level (-35 m OD, coloured dark blue). Black arrows indicate the base of submarine cliffs, the tops of which are at around 20 m below sea level. There is no seafloor-sediment-transport connectivity between the beaches losing sand and the Helwick bank. Sand transported from Port-Eynon and Horton offshore during storms cannot return once beyond the submarine cliffs, and the eastern end of the Helwick bank is a position fixed by the rocky headland where flood and ebb tides transport sand clockwise from the north flank to the south side. Similarly, Oxwich and Langland bays where sand is being lost cannot be influenced by dredging at the Helwick bank.
The bottom line is that both the Helwick sand bank and local beaches lose sand in major storms, with redistribution of this material by tidal currents and with Helwick able to recover its volume by sand migration from the northwest. The reason(s) for the long-term Gower beach sand loss remains enigmatic and worthy of continued consideration. Casting off for a moment from evidence-based understanding, the reader is reminded that the storminess of the ‘Little Ice Age’, which seemingly onset on Gower from about 1300 AD and ended in the mid 1800s, piled a huge amount of sand higher on the coast than previously; really, a lot! It seems just conceivable that the recent historical beach sand loss is part of some return or readjustment to a dynamic equilibrium that existed in the bays before the ‘Little Ice Age’.
Golden sandy beaches are not fixed entities in a changing climate; we old timers were just born lucky.
References
Hydraulics Research Wallingford (2016) Review of aggregate dredging off the Welsh coast: Review of evidence. Report DDM7582-RT001-R05-00, 56pp.
Lewis MJ, Neill SP, Elliott AJ (2015) Interannual variability of two offshore sand banks in a region of extreme tidal range. Journal of Coastal Research, 31, 265-275.
Phillips MR (2008) Beach erosion and marine aggregate dredging: A question of evidence? The Geographical Journal, 174, 332-343.
Schmitt T, Mitchell NC (2014) Dune-associated sand fluxes at the nearshore termination of a banner sand bank (Helwick Sands, Bristol Channel). Continental Shelf Research, 76, 64-74.
Schmitt T, Mitchell NC, Ramsay TS (2007) Use of swath bathymetry in the investigation of sand dune geometry and migration around a near shore ‘banner’ tidal sandbank. In: Balson PS, Collins MB (eds) Coastal and shelf sediment transport. Geological Society of London, Special Publications, 274, 53-64.
